If you want to improve any of your digital marketing efforts, you first have to understand what is happening on your website and what actions your visitors are taking.
For a lot of websites, 35 million according to Builtwith, this data is coming from Google Analytics, and changes are your website is running at least one flavor of Analytics. Maybe you’re running Universal Analytics, also known as Google Analytics 3, or you’ve already switched to the newer Google Analytics 4.
Understanding the basics of Google Analytics is the first step to making sense of your website visitors.
In this blog post, we’ll go through the steps you need to take to install Google Analytics on your website and how to make sense of the different reports so you can use that data to help grow your business online.
Table of Contents
- What is Google Analytics?
- Is Google Analytics Free?
- Why choose Google Analytics?
- How Google Analytics 4 works
- Measuring data points in Google Analytics 4
- Reporting on user behavior in Google Analytics 4
- How to analyze data with Google Analytics 4
- Turn insights into actions
- How to get started and set up Google Analytics 4
- Step 1: Create a Google Analytics account.
- Step 2: Add a Data Stream or View to your property.
- Step 3: Install the Google Tracking code on your site
- Adding the Google Analytics Tag to the most commonly used CMS platforms
- Adding the Google Analytics Tag to other CMS platforms
- Adding the Google Analytics Tag using Google Tag Manager
- Step 4: Verify your tracking is working.
- Tracking events and conversions in Google Analytics 4
- Does UTM tagging still work in Google Analytics 4?
- UTM tags in the Acquisition overview report
- UTM tags in the User acquisition report
- UTM tags in the Traffic acquisition report
- UTM tags in Google Analytics 4 real-time reporting
- Summary: Getting started with Google Analytics 4
What is Google Analytics?
But first things first. What is Google Analytics?
Google Analytics is probably one of the most popular services that Google owns, not taking into account Gmail, which has 1.5 billion active users. It is a web analytics tool that provides you with statistics and helps you to track and analyze the performance of your website or app so that you can learn and improve the experience for your visitors.
It tracks website performance and collects visitors’ insights, and it can help you and your business (or your clients) to:
- determine the top sources of user traffic
- learn about the success of your marketing activities and campaigns,
- track goal completions (such as purchasing a product, adding a product to a shopping cart, etc.)
- discover patterns and trends in visitor engagement
- learn visitor information like demographics
Companies of all shapes and sizes use Google Analytics to create better content, sell more of their products and services and grow their business through digital marketing.
The only thing you need?
Is a Google account, but you can also create one with your existing (non-Gmail) account.
Is Google Analytics Free?
Although most people probably don’t even know, but there is both a free and a paid version of Google Analytics. Where the latter is called Google Analytics 360.
Most businesses probably will have more than enough data to play around with in the free version and probably don’t even have the money to start paying for an Analytics 360 account, as pricing starts at $150,000 per year (invoiced monthly) and increases in price if your site receives more than one billion monthly visitors.
With the free Google Analytics, there are currently two versions available. Universal Analytics (UA) and Google Analytics 4 (GA4)
What is Universal Analytics (UA)?
If you’ve created a Google Analytics account already in the past, before October 2020, you’d probably have a Universal Analytics account. And this is probably the version you’ve seen around online in any form of training and articles the most.
However, Google Analytics started to work on its successor already some time ago and is being sunset on July 1st, 2023 (with Google Analytics 360 being replaced with a paid version of GA4 on July 1st, 2024).
What is Google Analytics 4 (GA4)?
Google Analytics 4, the successor to Universal Analytics, is a complete rebuild from the ground up. Most of the features of Universal Analytics are already in place, although some are still being built at the moment.
Tracking works differently in Google Analytics 4, where Universal Analytics is based on sessions and pageviews, and GA4 is based on events and parameters.
Not sure which version you’re running at the moment? Look at the screenshot below; the interface on the left is the old UA, and the one on the right is GA4.

One very important note, if you want to use Google Analytics for your business or if you’re already running the old Universal Analytics but did not activate a GA4 property yet, now is the time to do so.
You can run them easily in parallel next to each other, but because UA will stop accepting any new data on July 1st, 2023, it is best to either start just with GA4 if you need to start right now or add GA4 into your arsenal if you’re already using UA so you can have the overview and comparison data better year over year.
Why choose Google Analytics?
Perhaps one of the easiest answers here is that Google Analytics is free for almost everyone (unless you really have a lot of data). This, of course, ensures that a lot of people are using it, and that ensures a large community contributes with helpful resources like this one to share information and help you guide on your way.
Another great advantage is the fact that because so many different people at so many different levels and organizations need and want to use it, Google has to make sure that it works for all different skill levels. Whether you’re a seasoned pro or just starting with Google Analytics, it can give you information on what marketing channels drive traffic to your site, how they went through the conversion funnel, at what time of the day, etc.
And finally, as marketers, we’re used to using many different Google tools, such as Search Console, Google Ads, Google Looker Studio (previously Google Data Studio), Google Tag Manager, Google Optimize, and so much more tools to help you make well-informed marketing decisions. And, of course, as these tools are all owned by Google, they all perfectly integrate with Google Analytics.
How Google Analytics 4 works
If you want to start working with Google Analytics 4, you can divide your work into four steps:
- Measuring
- Reporting
- Analyzing
- Action Plan
Measuring data points in Google Analytics 4
Let’s start at the top and work our way down. When you create a new account or an account using the Migration Assistant, it will present you with two ways to measure your visitors (more on the complete setup in the next section).
The first one is using the Global Site Tag (gtag.js), or our preferred method, using Google Tag Manager.
If you don’t use either one of these two options, no data will flow into your GA4 account, and you might have created an account, but in the end, it is still quite useless.
When installed correctly, you can see data coming into your real-time report. All other data has to wait for 24 hours to be first processed before it becomes available. To see any of the real-time data, click on the graph icon in the left menu bar and select « Real-time. »
All the data points that come into your GA4 setup are visible here, and it can give you a quick glance at what is happening on your website or in the application where the tracking is running.
Reporting on user behavior in Google Analytics 4
The moment you have (a basic) measurement plan implemented, let’s start to look at some basic reporting.
If you’ve just started with your first steps into GA4, you probably are not going to build (big) custom dashboard (yet), so you will start to use the pre-built reports that come with GA4 to view the data from your website or apps.
The most common are:
Acquisition reports: Reports > Life cycle > acquisition > acquisition overview
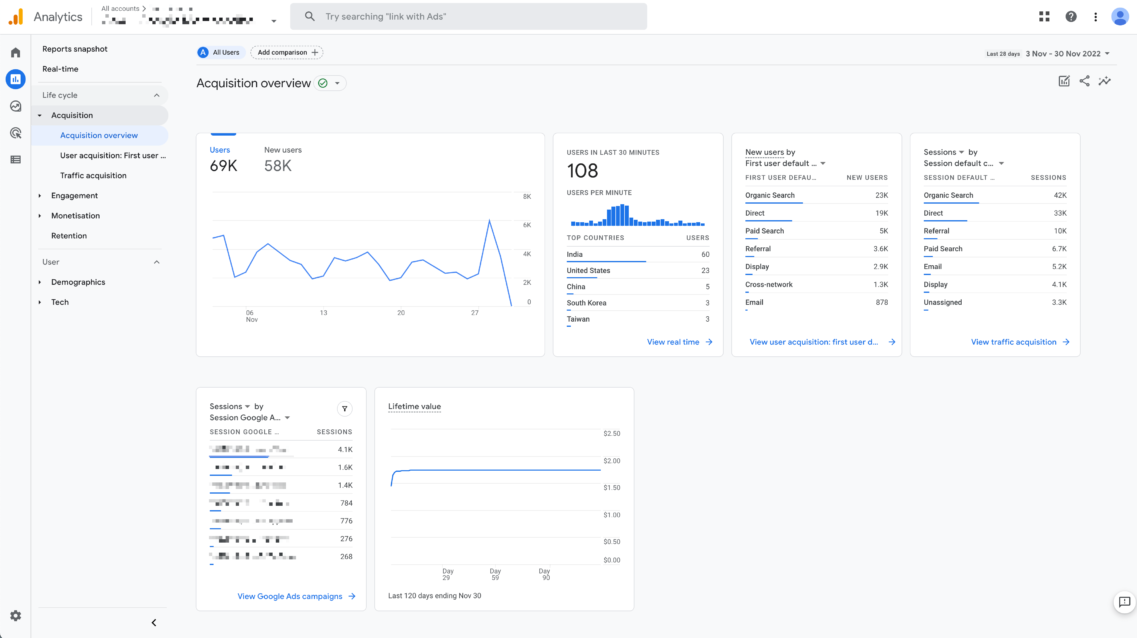
The acquisition report shows you how people are arriving on your website.
Engagement reports: Reports > Life cycle > Engagement > Overview
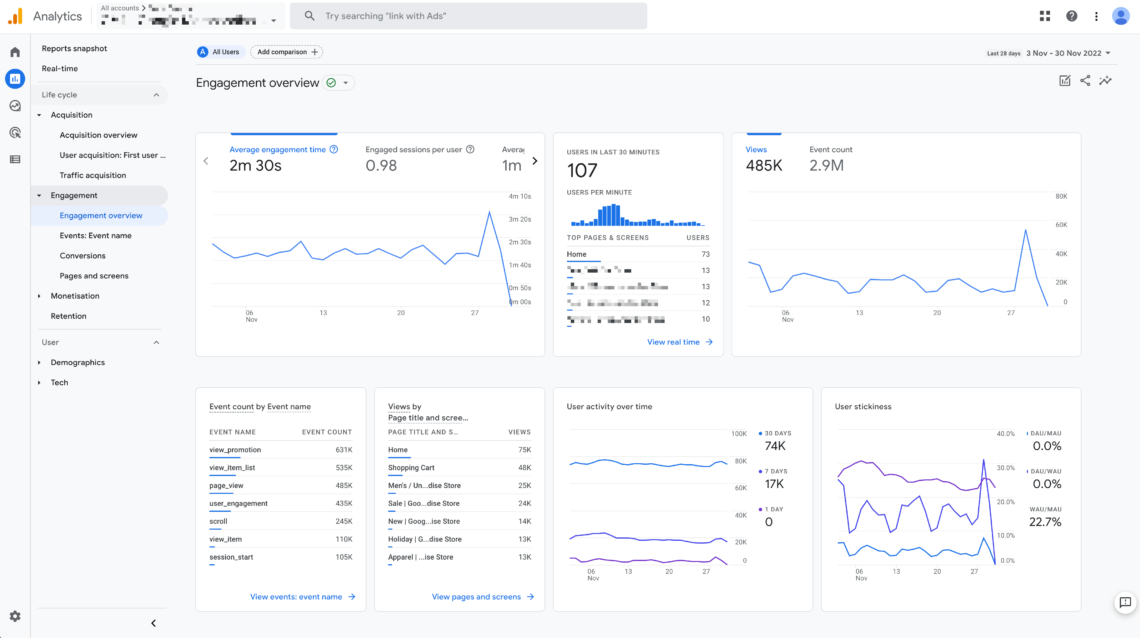
If you’re looking to figure out how people interact on your web page, use the built-in engagement report.
Demographic reports: Reports > User > Demographics overview
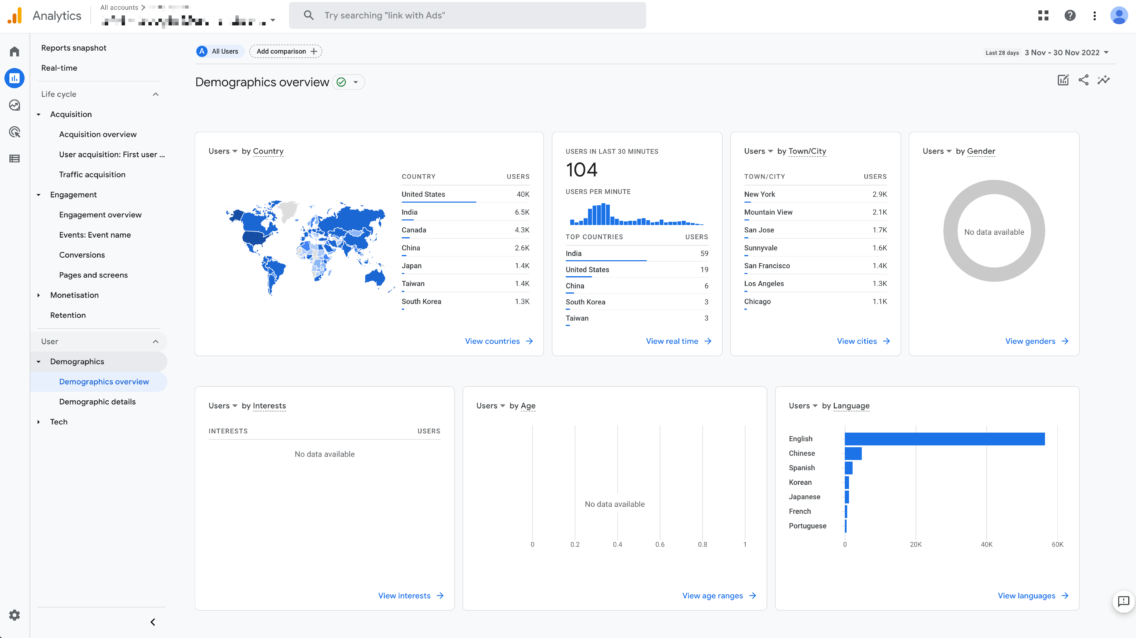
If you want to know more about the demographics of the people visiting your website or interacting with your app, use this report to get information like location, age, and interest.
Of course, this is only a small section of the built-in reports, but you’ll get a rough idea of what is capable when using Google Analytics 4. Of course, if you want, you can go deeper and get even more specific or build custom reports just for your business to view the information you care about.
So now that you have a basic understanding of the reporting capabilities with GA4. And of course, this data is super valuable, but the most important thing comes in the next step:
How to analyze data with Google Analytics 4
You can use the gathered data inside of GA4 to analyze your data, but one of the big advantages of GA4 over UA is that it has the ability to analyze your data even further using Google’s BigQuery, for example.
Especially if you’re working with large datasets, BigQuery becomes super valuable.
Another way to look further is to utilize the helpful feature within your GA4 property: explorations.
When you go to Explore from the left-hand menu, you will find a bunch of predefined templates that will help you get started to do some powerful audience discovery and comparison on the data inside GA4.
This will give you way deeper insights into your customer’s behavior.
So not sure if you can find the correct answer to your data questions as part of your analysis with the default reporting items in GA4? You can easily find different ways to find the answers to very specific questions using these templates as starting points.

For example, the funnel exploration one shows you all the steps someone takes before converting.
So what will you do after you gain those insights?
Turn insights into actions
The next logical step in your Google Analytics workflow would be to take the insights you’ve gathered from the previous three steps and turn them into actions.
Maybe you can figure out some A/B or split test on changing product pages for your e-commerce store or landing pages for your lead magnets.
Whatever you decide, write down your hypothesis, come up with an experiment and measure the results again in Google Analytics to see if the changes you made had a positive, negative, or no impact on your business.
These are only the high-level capabilities you can do together with Google Analytics 4, but before you can do any of these, let’s first start by implementing Google Analytics on your website.
How to get started and set up Google Analytics 4
Now that you’ve got a basic understanding of what you can do with Google Analytics 4, let’s create an account.
If you’re setting up a Google Analytics 4 property for the first time, here’s a step-by-step guide to follow.
Step 1: Create a Google Analytics account.
First, go to https://www.google.com/analytics/ and sign in with your existing Google account by clicking « Get started today ».
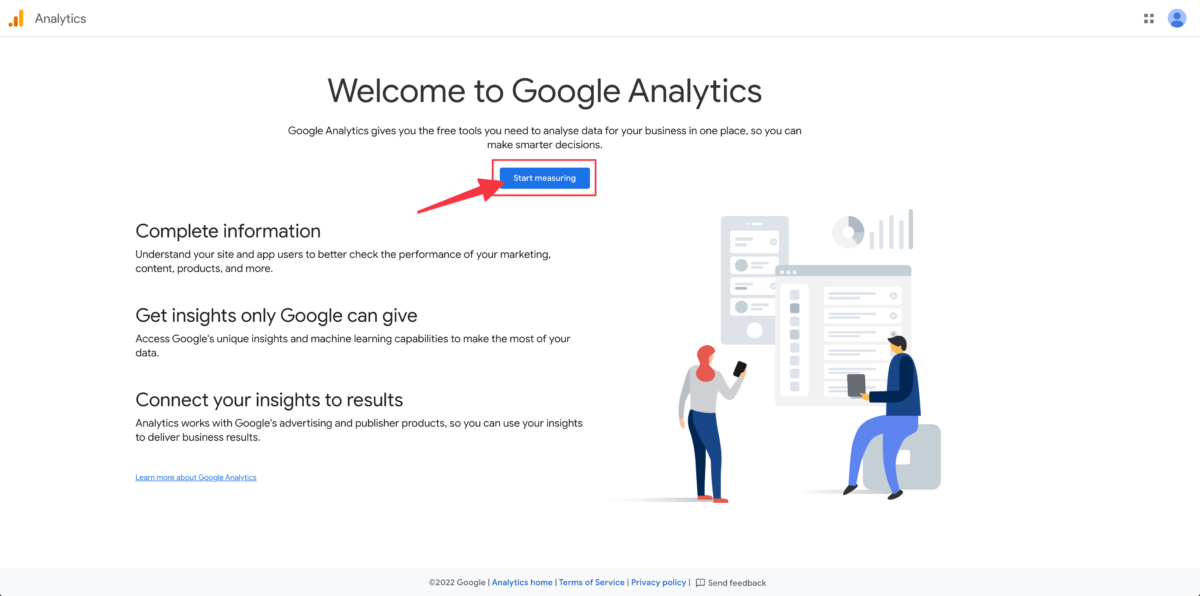
If you don’t have a Google account yet, you can create one on the spot here. Otherwise, just sign in with your existing credentials.
After signing in, we can go two routes:
If you’ve never set up a Google Analytics account before for your business, you will be prompted with a landing page and a call-to-action « Start measuring« .
If you’re an existing user: Head to the ‘Admin’ section and select the correct account. Navigate to the ‘Property’ subsection and click « Create Property ». You may have to request Editor access from your client if you don’t already have it.
In the next step, you will need to give your Google Analytics account a name.
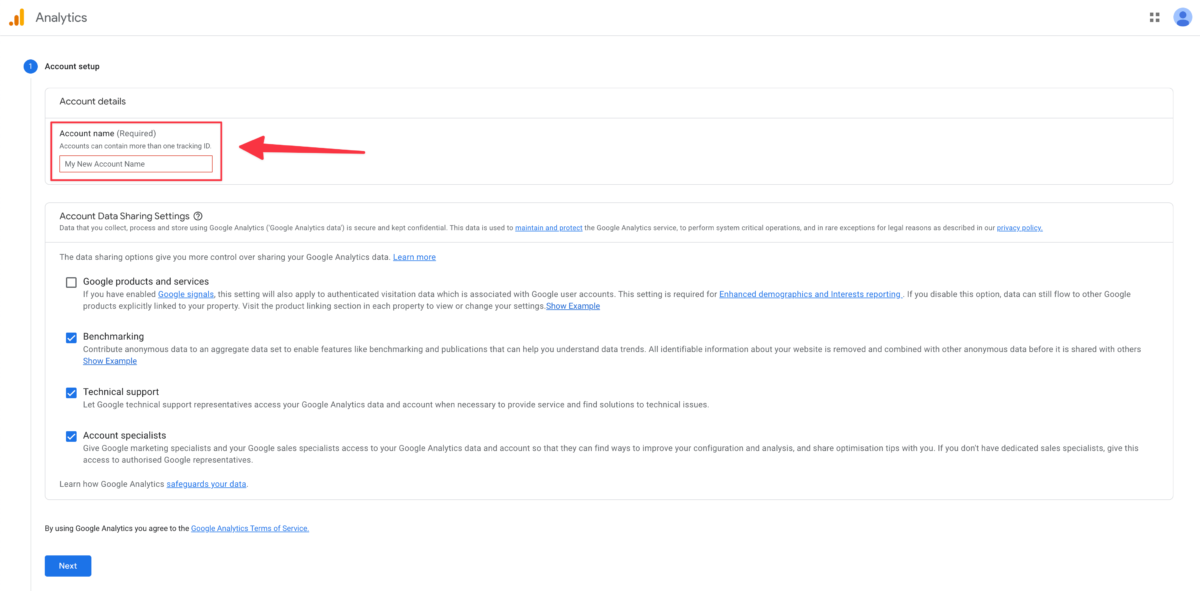
Pro tip: As an account name, use something easy to identify later. Especially when you create an account on behalf of a client of yours, you might want to give it something like the client name so you can easily remember which account belongs to which client. One Google Account can hold up to 100 properties, so consolidating in this way will save you time and headaches.
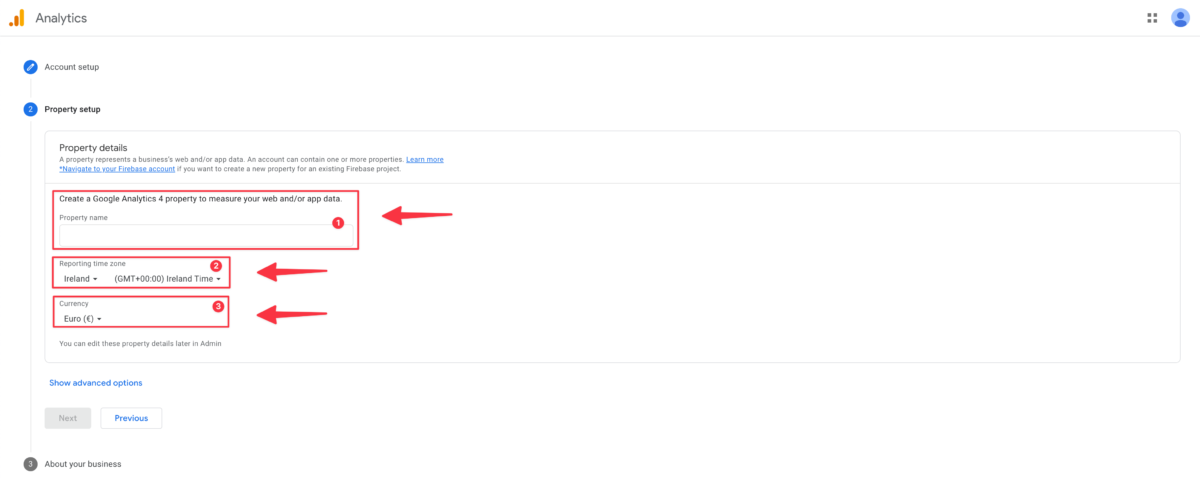
Next up, give the property an appropriate name like « [Business] website » (1), select the correct reporting timezone (2) and the currency (3) that you’re using (this is for reporting on the value of conversions later on)
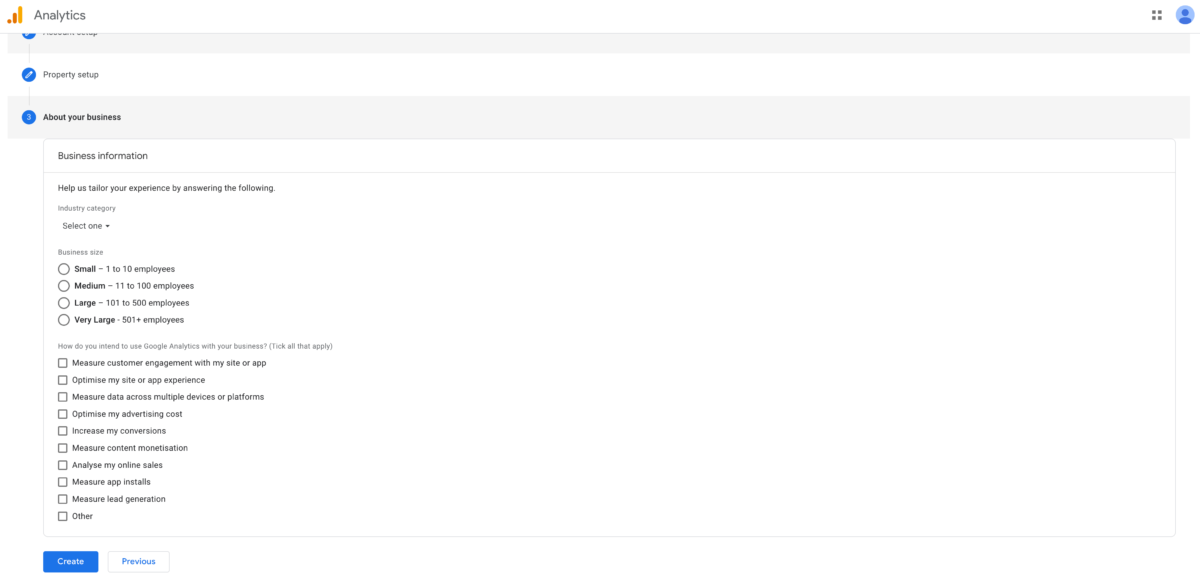
And in the final step, Google wants to know a little bit more about your business: the industry you’re operating in, your business size, and what you will use GA4 for.
Read the terms and conditions and accept them, and you’re good to go.
You’ve now created your (first) Google Analytics property, but we’re not there yet.
Step 2: Add a Data Stream or View to your property.
For Google Analytics to work, it needs to collect data. For example, when someone fills in a contact form on your website, that page view and the information that a form is filled in must be sent to Google Analytics.
Google does this with so-called « Data Streams« , with these data streams, Google can track the analytics and customer behavior across different devices. Google does this in three ways: Web, IOS, and Android.

If you’re not automatically redirected to the above screen, you can add a data stream to your Google Analytics account by going to Admin > Data Streams > Property
Select which type of platform you want to start tracking, and follow the instructions to configure your platform of choice.
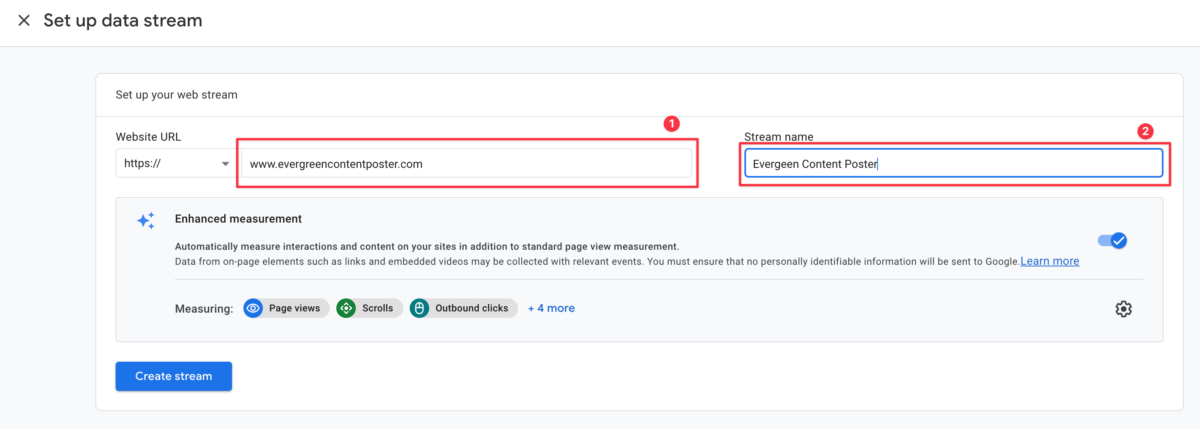
If you choose Web, fill in your web address or URL (1) and the name you want to give to the stream (2) and click « Create Stream« .
If you want to create more streams (let’s say for your mobile apps as well), repeat the above steps for each additional stream.
Step 3: Install the Google Tracking code on your site
When you’ve created your stream, you will receive a measurement ID that needs to be connected to your website. This is a way of proving the site’s ownership and tethering it directly to Google Analytics so that the entire system can work properly.

There are a bunch of different ways you can add this tag to your website. If you fill in your URL in the above screen, Google will scan your website and will present you with the easiest way to implement this.
Adding the Google Analytics Tag to the most commonly used CMS platforms
If your client hosts their website on a popular CMS platform such as WordPress.com websites, self-hosted WordPress, Wix, or Squarespace, you’ll have to find a “G”-ID code to input on the Google Analytics field on the CMS backend. To do so:
- Go to Admin > Property > Data Streams > Web
- You’ll see a code on the top right under “Measurement ID” which is your “G”-ID. Copy and paste this code by following the instructions for the respective CMS platform you’re using. Here are a few instruction references for WordPress.com websites, self-hosted WordPress, Wix, and Squarespace.
Adding the Google Analytics Tag to other CMS platforms
For other CMS platforms that don’t support “G”-ID, you’ll have to copy and paste a global tag into the custom HTML section. To get started,
- Go to Admin > Property > Data Streams > Web
- Scroll to Tagging Instructions and look for the Add new on-page tag column.
- Click on the first option, which is the Global site tag (gtag.js).
- Copy and paste this entire code into the custom HTML feature of the CMS platform.
Adding the Google Analytics Tag using Google Tag Manager
And finally, if you’re using Google Tag Manager to manage pixels and other tags on your website (our preferred method):
- Log in to Google Tag Manager
- Select the correct Tag Manager account for your website
- Then go to your Google Tag Manager container > Tags > New and choose GA4 configuration.
- In the Measurement ID field, enter the ID that you copied in the GA4 interface. Keep the Send a page view event when this configuration loads if you want to automatically track pageviews.
- In the Triggering section, select All Pages and then name the tag, e.g. GA4 – Pageview.
- Publish your changes in Google Tag Manager
Step 4: Verify your tracking is working.
Lastly, verify your code is working. You can do this by looking at the Real-Time reports section while clicking around on your site in a different tab or on your phone.
The report should show at least one visitor to the site (that’s you!)
Tracking events and conversions in Google Analytics 4
If you’ve ever used Universal Analytics in the past, you might remember that page views were always the most important metric. With Google Analytics 4, as mentioned earlier, GA4 is focused on engagement, so all user activity, including page views, are tracked as events.
This gives a great advantage, as you can now gain a much fuller understanding of how people are interacting with your website or app.
What does this mean for you and your business?
You can still view session-level reporting, but the ability to break it down by interaction means more in-depth reports and insights.
For this, it has an array of new metrics. Things like engaged sessions, engagement rate and time, better attribution, demographics, etc.
It might take a little bit to get used to, but this means by having access to more data, you can easier track your (potential) customers through their entire marketing journey.
By turning everything by default into events, this also means setting up conversions is a lot easier.
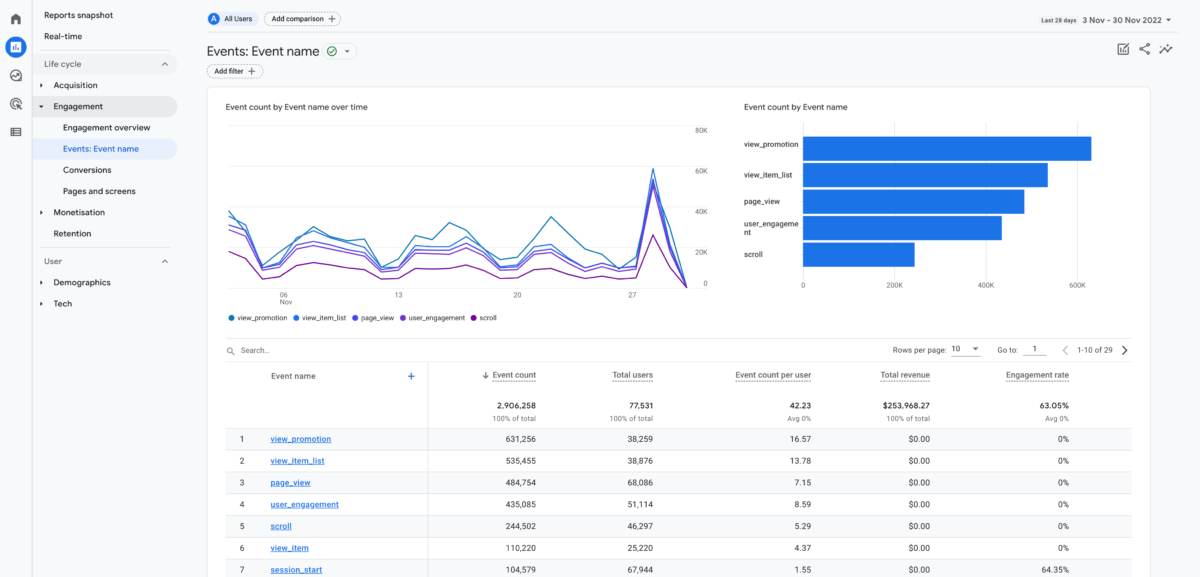
If you go to Reports > Engagement > Events: Event name, you can get an overview of all the events already tracked by default.

If you think a certain event is important enough for your business to be marked as a conversion, simply press the three dots at the end of the row and select « Mark as conversion » to mark an event as a conversion for your business.
While the basic events might be enough for your business, most businesses only want specific clicks to be counted as conversions. This is where the ability to create and edit your own events comes into play.
Go to Admin > Property > Events

You can modify existing or create new events yourself. You can give your event a name and the conditions that need to apply for the event to be triggered.
For example, you can create a special event for when someone visits your contact page.
Note: there is a 24-hour delay in Google Analytics 4 for events to start showing up in your reporting. If you want to verify that an event is working correctly the moment you create one, head over to the real-time reporting to see your event while you test it out.
Does UTM tagging still work in Google Analytics 4?
Yes, although there seems to be a bit of a lack of information about the subject from Google.
If you’ve been working in marketing for some time, you probably know the importance of knowing where most of your traffic is coming from. And sure, Google Analytics tracks which platform your visitors and conversions are coming from, but it doesn’t really show you the specific link or ad that was clicked.
This is where UTM tracking codes come into play.
UTM tags allow you to easily find the success of your individual posts or from profile visits on your Google Business profile, or when you create engaging social media content, which of those posts performs better in attracting visitors to your website?
![]()
As you can see, we support them within the Evergreen Content Poster, too. Just head over to the plugin’s settings page and enable UTM tracking.
If you want to create UTM tags manually for all your other campaigns, the easiest and most effective way to do this is by either using Google’s URL Builder or a browser extension that helps you create UTM tags.
So, where can you find this information in Google Analytics 4?
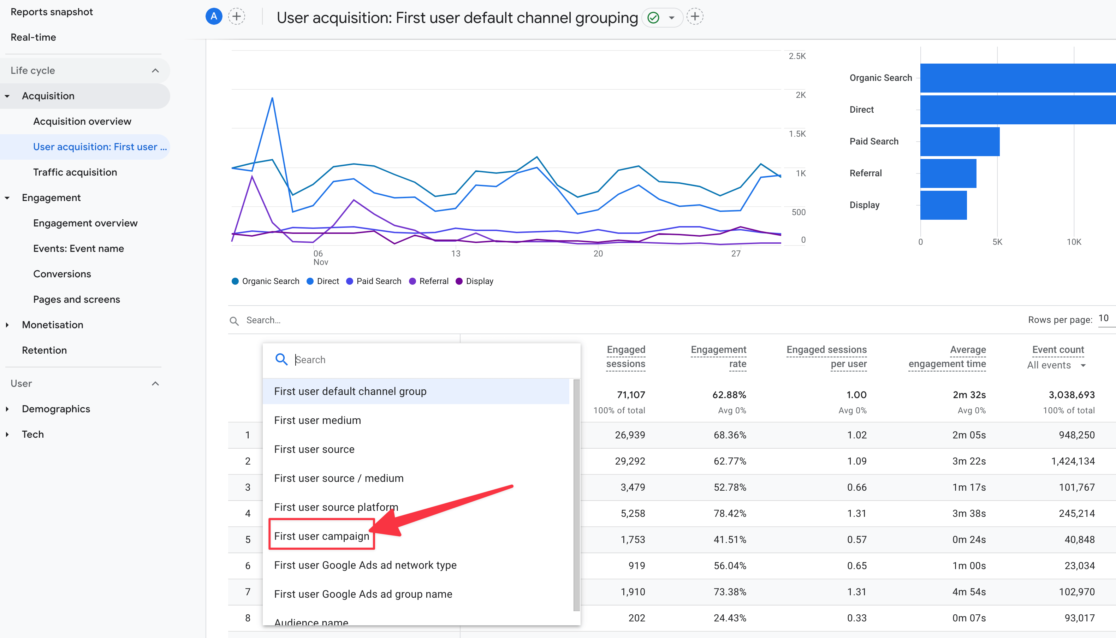
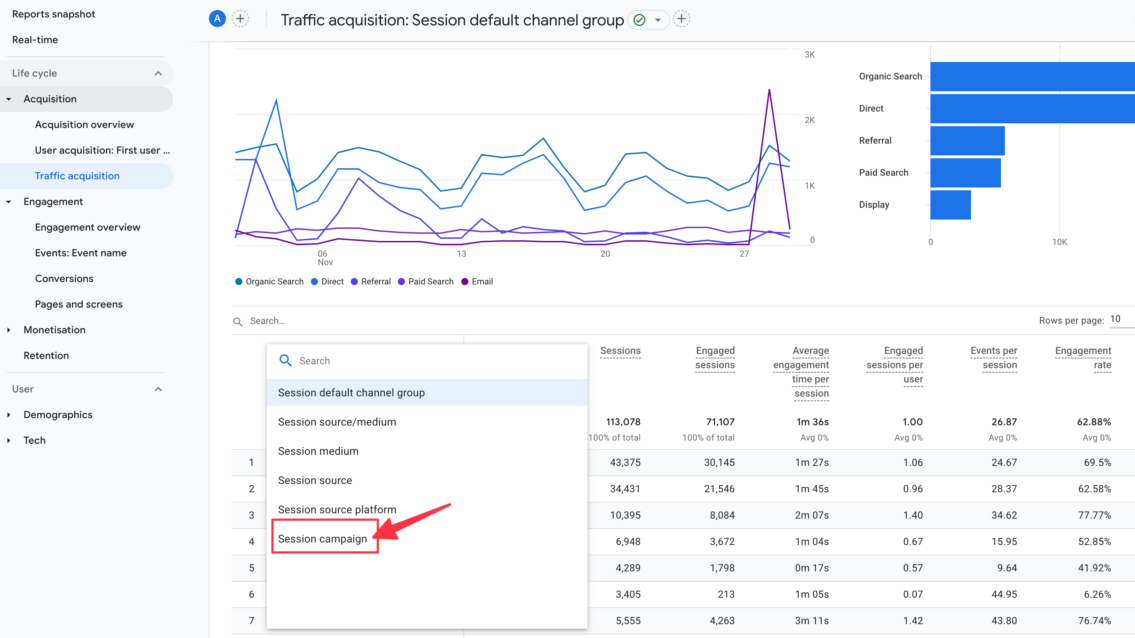
In GA4, you can see UTM campaign data in all 3 Acquisition reports: Overview, User acquisition, and Traffic acquisition.
To find your UTM data in your Google Analytics GA4 property, go to Reports > Acquisition (under Life cycle).
UTM tags in the Acquisition overview report
If you click on Acquisition overview, you can find your UTM campaign data in the session medium and campaign cards. If you want, you can toggle between session data and engaged session data.

UTM tags in the User acquisition report
By clicking on User acquisition and then clicking on the dropdown above the first report column, you can then select First user campaign to view UTM data in the user acquisition report.
UTM tags in the Traffic acquisition report
Finally, you can also view information about your UTM tags in your Traffic acquisition report. Click on Traffic acquisition. Click on the dropdown above the first report column. Select Session campaign.
UTM tags in Google Analytics 4 real-time reporting
Remember that delay of 24 hours before you can see any data or events coming into Google Analytics 4? What if you just launched an email campaign and want to see that impact with their UTM tags in your real-time overview?
In the DebugView report, you view each campaign UTM parameter for a page_view event in real time.
Go to Configure > DebugView
Click on the page_view event in the vertical timeline when it appears.
View the page_view event Parameters to the right of the timeline. Expand the campaign, content, medium, and source parameters to see each UTM parameter value.
Summary: Getting started with Google Analytics 4
Sure, Universal Analytics isn’t going away until July 2023, but that time is here before you know it. If you’re already tracking your website visitors with Universal Analytics, create a new Google Analytics 4 property as soon as possible and start gathering data next to your existing property.
If you haven’t started tracking your website visitors up until now, it’s time to install Google Analytics 4 and let it provide you with the data you need to help grow your business online.
Fortunately, as you can see, setting up a Google Analytics 4 property on your website or app is super easy and straightforward. The steps outlined in this article should be doable to complete in 10 minutes or less, so there is no excuse to start tracking your website visitors anymore.
Are you using Google Analytics 4, or haven’t you made the switch yet from Universal Analytics, or maybe you’re using a completely different tracking solution like Piwik? We’d love to hear your thoughts in the comments below.
